
A Phone Call, and a Late Report
May. Tuesday afternoon. A hotel general manager opens the monthly report.
The numbers are down 14% year-over-year.
A thought flashes through his mind — last month during his rounds, the lobby seemed quieter than usual at that hour. But there’s no “lobby quietness” column on the monthly report, so he files it away as intuition and pushes it aside.
He calls the department heads. Reservations says Easter shifted dates. Marketing says a competitor slashed prices. F&B says two banquet events were canceled. Every explanation is reasonable. Every explanation points in the same direction: things that already happened.
He does what an operator should do — cuts prices, increases marketing spend, changes the menu.
Two months later, the numbers drop another 9%.
You’ve Been Watching the Rearview Mirror
This isn’t about his professionalism. This is the default mode for the vast majority of operators, because the tools at hand are designed that way.
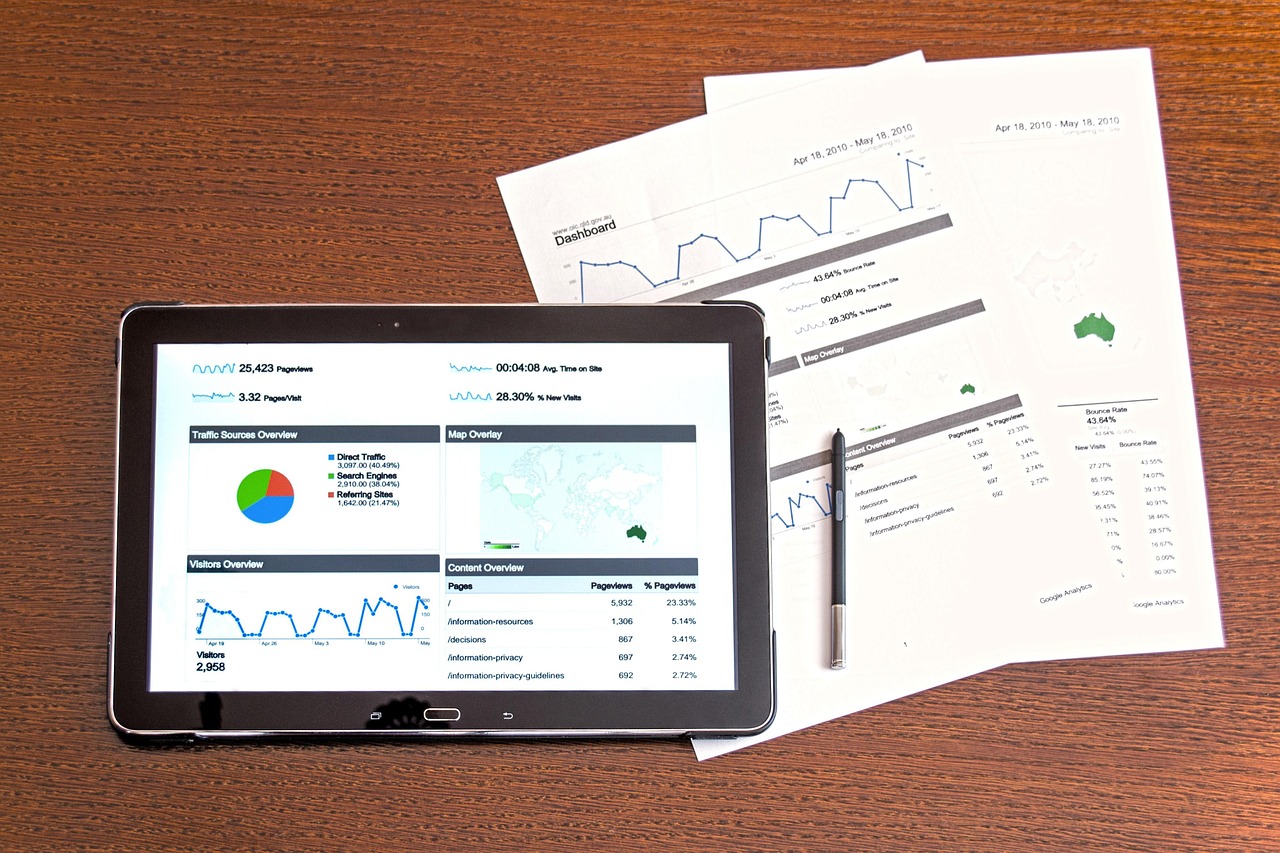
Open the monthly report — RevPAR, occupancy rate, average check. It describes last month.
Open the reservation system — bookings for the next 30 days. It describes people who have already made their choices.
Open the P&L statement — cost structure, gross margin. It describes past efficiency.
These numbers share one characteristic: they are all outcomes.
Not a single column tells you “why.” Not a single metric tells you “what’s next.” You think you’re making data-driven decisions, but what you’re actually doing is using results from three months ago to chase a problem that started three months ago.
More precisely: the people who considered you but decided not to come never appear on any report.
Lagging Indicators vs. Leading Indicators
Economists have categorized statistical data into two types for decades.
Lagging Indicators — tell you what already happened. GDP growth rate, unemployment rate, corporate revenue. Accurate, authoritative, complete. But by the time the numbers confirm, the trend has long since formed.
Leading Indicators — signals that turn “before” the outcome occurs. Purchasing Managers’ Index (PMI), new housing starts, consumer confidence index. Imperfect, noisy. But they give you time to react.
How important is this distinction? The National Bureau of Economic Research (NBER) officially declares recessions an average of 6 to 12 months after they actually begin. By the time they announce “we’ve entered a recession,” it’s already half over.
Your monthly report is your NBER.
The Standard Hospitality Toolkit Is Entirely Retrospective
This isn’t to say the hospitality industry lacks metrics. Quite the contrary — the metric system is very comprehensive:
| Metric | What It Measures | Time Direction |
|---|---|---|
| RevPAR (Revenue Per Available Room) | Past pricing + occupancy efficiency | Retrospective |
| ADR (Average Daily Rate) | Result of past pricing strategy | Retrospective |
| Occupancy | How many rooms were sold in the past | Retrospective |
| Pace (Booking velocity) | Current accumulation vs. same period | Retrospective (those who already chose) |
| GOPPAR (Gross Operating Profit Per Available Room) | Past cost control | Retrospective |
Five metrics. All five describe the past.
This doesn’t mean they’re useless — a health checkup report is also useful. But if you rely solely on health checkup reports to prevent heart disease, by the time cholesterol levels are flagged, your arteries are already 70% blocked.
What you need isn’t more health checkup reports. What you need is a tool that senses changes daily.
And the problem is more serious than you think. Not only are standard KPIs retrospective — even your “corrective measures” are retrospective. You see revenue decline → you decide to cut prices → price cuts take time to take effect → by the time you see results, two more months have passed. The entire decision cycle from “problem occurs” to “measure takes effect” often takes four to six months. And during those four to six months, the problem may have already self-corrected — or more likely, already deteriorated beyond recovery.
This is the real danger of “driving with the rearview mirror”: it’s not that you can’t see ahead. It’s that you turn the steering wheel based on what you see behind you, and by the time the wheel turns, the car has already hit the wall.
What Does a Real Leading Indicator Look Like?
The economics profession has strict criteria for defining a “leading indicator”: it must turn “before” the outcome occurs, and the direction of the turn must have a causal relationship with the subsequent outcome (not just coincidence).
The Conference Board publishes a “Leading Economic Index” (LEI) monthly, containing ten sub-indicators. One is called the “Consumer Expectations Index” — consumers’ economic outlook for the next six months. This index began declining in July 2007, fourteen months before the 2008 financial crisis.
Does your hotel have a similar “consumer expectations index”? Yes. You’ve just never treated it as an indicator.
“It Usually Drifts Quietly First, Then Drops”
Jamie Freeman, Head of Performance at New Zealand’s Star Group, oversees multi-property operations. In a February 2026 interview, he said:
“Financial performance rarely deteriorates overnight. More often, it drifts quietly before it drops.”
He tracks earlier signals — macro policy, tourism flows, supply chain pressure, forward bookings. These signals start turning months before revenue drops.
But then he said something truly piercing:
“Many leadership teams don’t take it seriously until the numbers confirm what the leading signals had already suggested.”
Is that you? It’s not that you can’t see the signals. It’s that you only trust the numbers on the report. And the report is always three months behind reality.
So, What’s the Real Problem?
It’s not that “revenue reports are useless.” Revenue reports are necessary — just as health checkup reports are necessary.
The problem is: if revenue reports can only tell you “outcomes,” where do you find “causes”?
If all standard KPIs describe the past, what tool can tell you “what will happen in the next three months”?
Do you have a mechanism that catches signals before guests leave, before bookings disappear, before revenue drops?
That general manager only found out later: starting in April, guests had already been telling him. Not through the reservation system, not through reports. In another way — a way he wasn’t reading at the time.
In April’s Google reviews, someone wrote “Soundproofing isn’t great — you can clearly hear the next room.” In early May, another: “The room is a bit dated, bathroom tiles are cracked.” Mid-May: “Service attitude was mediocre, waited 20 minutes at check-in.”
Three reviews. Three different guests. Three different aspects. But one common signal: experience quality was declining.
If he had seen the “soundproofing” issue in the first April review, he could have scheduled soundproofing improvements in May. If he had seen “check-in takes too long” in May, he could have adjusted front desk scheduling. Every review was an early warning — one or even two months ahead of the monthly report, ahead of booking data, ahead of his intuition.
But he wasn’t reading reviews. He was reading reports. The reports told him “the numbers are fine.” By the time the numbers finally went wrong, guests had already been voting with their feet for three months.
But that’s a topic for the next article.
Leave Your Email to Complete a Three-Minute Self-Assessment
Your reports are all looking at the past — but what percentage of your time is spent looking at future signals? Leave your email to unlock a lagging vs. leading indicators self-assessment checklist. Three minutes to figure out which side you’re watching.
Further Reading
Your reports are beautifully formatted and logically coherent, but they don’t tell you why guests stopped coming
This article established the problem: revenue is a lagging indicator, and you’ve been watching the rearview mirror. But if you decide to look for leading indicators — why aren’t even the most advanced methods on the market sufficient? What do they collectively miss?
Loading…